
Calibration creation and performance evaluation
In addition to out-of-the-box performance, Afri-SET provides calibration equations and models for end-users using the following methods. As discussed in the literature1, calibration equations and models are best deployed in a collocated fashion, i.e. models should be used where they are developed. Afri-SET cautions end-users in using the developed calibrations in environments that are substantially different from the collocation site in Accra (i.e. West-African urban background) and encourages users to develop collocated calibrations if at all possible. Note that many manufacturers apply calibrations of their own. Afri-SET provides calibration equations for sensors (using the rainy, dry, and combined datasets for a total of 3 models) with and without these manufacturer calibrations and it is up to Afri-SET end-users to determine if applying an additional layer of calibration (ensemble learning)3 is beneficial or not. It should also be noted that independent calibrations such as those made at Afri-SET are technically dependent on the firmware version of a given sensor at the time of model development.
Model Development
Calibration models for both particulate matter and gas sensors are developed using only “defensible” variables (relative humidity, temperature, elapsed time, etc.) as opposed to questionable (wind speed/direction, temporal factors other than elapsed time, atmospheric mixing height, etc.) variables which move the calibration more into the realm of a statistical predictive model.2 For particulate matter (PM) low-cost sensors, the input variables are generally limited to reported PM concentrations from the sensor, ambient temperature, and ambient relative humidity. For gas sensors, all pollutant concentrations are generally included if available (e.g. units include multiple gas sensors, PM sensors) as well as ambient temperature and relative humidity.
Whatever the sensor in question, k-fold cross validation is used to evaluate developed models. A model with a given set of input variables that does not perform similarly across all k-folds of the data set are disregarded and the input variables are reselected to minimize autocorrelation among time-series data. A k-value of 5 is generally chosen at Afri-SET unless otherwise stated.
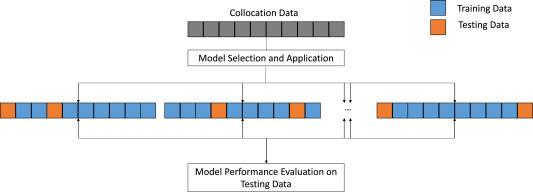
Figure 2: Visual representation of a random 5-fold cross validation on collocation data.
Low-cost PM sensors are generally evaluated with simple polynomial equations of the following form:
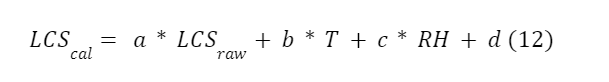
where LCScal is the calibrated output (matches with reference-grade sensor), LCSraw is the bias adjusted (Eq.3) raw data from the sensor, T is ambient temperature, and RH is ambient relative humidity.
Low-cost gas sensors are generally evaluated using machine learning algorithms such as random forest and neural network models, though polynomial models like Eq. 12 are first built. Details on what models are built for what sensors and how can be found in Malings et al. (2019).4
Given that a minimum of 3 units are evaluated at once, two types of models are built: individual calibration models for each unit using only that unit’s data and a general calibration model for each sensor model using an average of all units’ timestamp-paired data. The individual best performing model (highest scores in r, lowest scores in MNB, MAE, CvMAE - see next section) and general model are both available on the Afri-SET webpage.
Model Evaluation
Upon evaluating a unit and building the calibration models, the calibration models are evaluated for accuracy. For accuracy metrics, mean absolute error (MAE; eq. (13)) and root mean squared error (RMSE; eq. (14)) are reported:
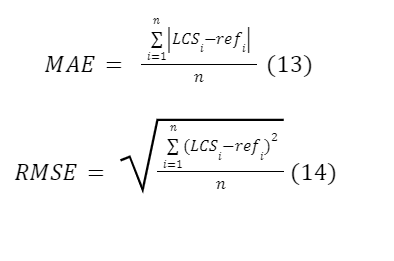
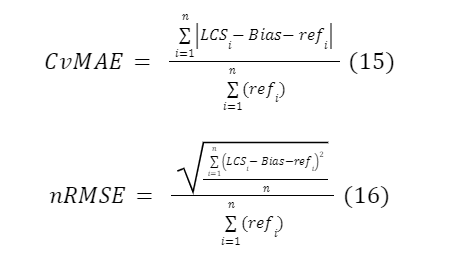
where all variables are as defined in Eqs. 2 and 3. Both MAE and RMSE give the average model prediction error and can range from zero to values as high as the measured concentrations themselves. RMSE weights large errors much more than MAE, which may or may not be desirable to a specific use case, so both are always provided. Both the MAE and RMSE can be normalized by the mean, standard deviation, difference between the maximum and minimum, the interquartile range, or any similar factor. The mean is likely the most physically intuitive statistic for PM concentration data, so Afri-SET also reports the bias-corrected mean normalized MAE and RMSE (CvMAE, nRMSE, eqs. (15) and (16))
Last updated
September 6, 2023
Previous
Low-cost sensor performance determination
Next
Data, Report, and Model Availability